Based on National Center for Health Statistics (NCHS) mortality surveillance data available on April 16, 2020, 11.9% of the deaths occurring during the week ending April 11, 2020 (week 15) were due to P&I. This percentage is above the epidemic threshold of 7.0% for week 15.
Information for selected week and previous two weeks, national summary, all ages
|
Week |
Number of Influenza Deaths |
Number of Pneumonia Deaths |
Total Deaths |
Percent Complete |
|---|---|---|---|---|
|
Selected Week (week 15) |
206 |
3,081 |
27,688 |
58.2% |
|
Week 14 |
342 |
6,017 |
49,292 |
> 100% |
|
Week 13 |
355 |
5,016 |
52,285 |
> 100% |
Note: Provisional death counts are based on death certificate data received and coded by the National Center for Health Statistics as of April 17, 2020. Death counts are delayed and may differ from other published sources (see Technical Notes). Counts will be updated periodically. Additional information will be added to this site as available.
[Note] Coronavirus disease deaths are identified using the ICD–10 code U07.1. Deaths are coded to U07.1 when coronavirus disease 2019 or COVID-19 are reported as a cause that contributed to death on the death certificate. These can include laboratory confirmed cases, as well as cases without laboratory confirmation. If the certifier suspects COVID-19 or determines it was likely (e.g., the circumstances were compelling within a reasonable degree of certainty), they can report COVID-19 as “probable” or “presumed” on the death certificate (5, 6).
Pneumonia deaths are identified using underlying cause-of-death codes from the 10th Revision of ICD (ICD–10): J12–J18, excluding deaths that involve influenza (J09–J11). Influenza deaths are identified from the ICD–10 codes J09–J11, and include deaths with pneumonia or COVID-19 listed as a contributing cause of death.
Table 1. Deaths involving coronavirus disease 2019 (COVID-19), pneumonia, and influenza reported to NCHS by week ending date, United States. Week ending 2/1/2020 to 4/11/2020.*
Data as of April 17, 2020
|
Week ending date in which the death occurred |
COVID-19 Deaths (U07.1)1 |
Deaths from All Causes |
Percent of Expected Deaths2 |
Pneumonia
Deaths |
Deaths with
Pneumonia and COVID-19 |
Influenza
Deaths |
Population5 |
|---|---|---|---|---|---|---|---|
|
Total Deaths |
13,130 |
582,565 |
92 |
45,019 |
5,902 |
5,228 |
327,167,434 |
|
2/1/2020 |
0 |
56,589 |
95 |
3,639 |
0 |
454 |
327,167,434 |
|
2/8/2020 |
0 |
57,114 |
96 |
3,633 |
0 |
488 |
327,167,434 |
|
2/15/2020 |
0 |
56,143 |
95 |
3,638 |
0 |
499 |
327,167,434 |
|
2/22/2020 |
0 |
55,690 |
96 |
3,491 |
0 |
516 |
327,167,434 |
|
2/29/2020 |
5 |
55,036 |
96 |
3,516 |
3 |
586 |
327,167,434 |
|
3/7/2020 |
20 |
54,476 |
94 |
3,614 |
11 |
566 |
327,167,434 |
|
3/14/2020 |
44 |
52,704 |
92 |
3,586 |
22 |
558 |
327,167,434 |
|
3/21/2020 |
454 |
52,271 |
92 |
4,005 |
209 |
479 |
327,167,434 |
|
3/28/2020 |
2,339 |
53,687 |
96 |
5,185 |
1,090 |
368 |
327,167,434 |
|
4/4/2020 |
5,457 |
52,992 |
95 |
6,549 |
2,620 |
371 |
327,167,434 |
|
4/11/2020 |
4,811 |
35,863 |
65 |
4,163 |
1,947 |
343 |
327,167,434 |
NOTE: Number of deaths reported in this table are the total number of deaths received and coded as of the date of analysis and do not represent all deaths that occurred in that period.
*Data during this period are incomplete because of the lag in time between when the death occurred and when the death certificate is completed, submitted to NCHS and processed for reporting purposes. This delay can range from 1 week to 8 weeks or more, depending on the jurisdiction, age, and cause of death.
1Deaths with confirmed or presumed COVID-19, coded to ICD–10 code U07.1
2Percent of expected deaths is the number of deaths for all causes for this week in 2020 compared to the average number across the same week in 2017–2019. Previous analyses of 2015–2016 provisional data completeness have found that completeness is lower in the first few weeks following the date of death (8).
3Pneumonia death counts exclude pneumonia deaths involving influenza.
4Influenza death counts include deaths with pneumonia or COVID-19 also listed as a cause of death.
5Population is based on 2018 postcensal estimates from the U.S. Census Bureau (9)
Data as of April 17, 2020
|
Age group |
COVID-19 Deaths (U07.1)1 |
Deaths from All Causes |
Pneumonia
Deaths |
Deaths with
Pneumonia and COVID-19 |
Influenza
Deaths |
Population4 |
|---|---|---|---|---|---|---|
|
All ages |
13,130 |
582,565 |
45,019 |
5,902 |
5,228 |
327,167,434 |
|
Under 1 year |
0 |
3,084 |
26 |
0 |
11 |
3,848,208 |
|
1–4 years |
2 |
608 |
31 |
2 |
27 |
15,962,067 |
|
5–14 years |
1 |
902 |
29 |
0 |
36 |
41,075,169 |
|
15–24 years |
13 |
5,204 |
104 |
5 |
37 |
42,970,800 |
|
25–34 years |
113 |
11,017 |
317 |
44 |
117 |
45,697,774 |
|
35–44 years |
289 |
15,826 |
692 |
99 |
188 |
41,277,888 |
|
45–54 years |
751 |
30,494 |
1,804 |
299 |
441 |
41,631,699 |
|
55–64 years |
1,773 |
73,874 |
5,404 |
746 |
963 |
42,272,636 |
|
65–74 years |
2,919 |
114,652 |
9,293 |
1,232 |
1,152 |
30,492,316 |
|
75–84 years |
3,576 |
144,138 |
12,476 |
1,698 |
1,165 |
15,394,374 |
|
85 years and over |
3,693 |
182,766 |
14,843 |
1,777 |
1,091 |
6,544,503 |
Data as of April 17, 2020
|
Sex |
COVID-19 Deaths (U07.1)1 |
Deaths from All Causes |
Pneumonia
Deaths |
Deaths with
Pneumonia and COVID-19 |
Influenza
Deaths |
|---|---|---|---|---|---|
|
Total deaths |
13,130 |
582,565 |
45,019 |
5,902 |
5,228 |
|
Male |
7,823 |
300,021 |
23,876 |
3,469 |
2,659 |
|
Female |
5,307 |
282,524 |
21,143 |
2,433 |
2,569 |
|
Unknown |
0 |
20 |
0 |
0 |
0 |
NOTE: Number of deaths reported in this table are the total number of deaths received and coded as of the date of analysis and do not represent all deaths that occurred in that period.
*Data during this period are incomplete because of the lag in time between when the death occurred and when the death certificate is completed, submitted to NCHS and processed for reporting purposes. This delay can range from 1 week to 8 weeks or more, depending on the jurisdiction, age, and cause of death.
1Deaths with confirmed or presumed COVID-19, coded to ICD–10 code U07.1.
2Pneumonia death counts exclude pneumonia deaths involving influenza.
3Influenza death counts include deaths with pneumonia or COVID-19 also listed as a cause of death.
|
Place of death |
COVID-19 Deaths (U07.1)1 |
Deaths from All Causes |
Pneumonia
Deaths |
Deaths with
Pneumonia and COVID-19 |
Influenza
Deaths |
|---|---|---|---|---|---|
|
Total |
13,130 |
582,565 |
45,019 |
5,902 |
5,228 |
|
Healthcare setting, inpatient |
9,385 |
166,008 |
30,549 |
4,769 |
3,411 |
|
Healthcare setting, outpatient or emergency room |
788 |
34,970 |
1,735 |
301 |
164 |
|
Healthcare setting, dead on arrival |
19 |
1,552 |
38 |
7 |
10 |
|
Decedent's home |
1,140 |
188,257 |
3,583 |
118 |
900 |
|
Hospice facility |
140 |
43,445 |
2,549 |
78 |
269 |
|
Nursing home/long term care facility |
1,550 |
111,415 |
5,800 |
595 |
407 |
|
Other |
107 |
36,824 |
755 |
33 |
67 |
|
Place of death unknown |
1 |
94 |
10 |
1 |
0 |
NOTE: Number of deaths reported in this table are the total number of deaths received and coded as of the date of analysis and do not represent all deaths that occurred in that period.
*Data during this period are incomplete because of the lag in time between when the death occurred and when the death certificate is completed, submitted to NCHS and processed for reporting purposes. This delay can range from 1 week to 8 weeks or more, depending on the jurisdiction, age, and cause of death.
1Deaths with confirmed or presumed COVID-19, coded to ICD–10 code U07.1.
2Pneumonia death counts exclude pneumonia deaths involving influenza.
3Influenza death counts include deaths with pneumonia or COVID-19 also listed as a cause of death.
Cases and mortality by country[https://coronavirus.jhu.edu/data/mortality last updated on Tuesday, April 28, 2020 at 11:52 PM EDT] |
||||
|
Country |
Confirmed |
Deaths |
Case-Fatality |
Deaths/100k pop. |
|---|---|---|---|---|
|
US |
1,012,582 |
58,355 |
5.8% |
17.84 |
|
Italy |
201,505 |
27,359 |
13.6% |
45.27 |
|
Spain |
232,128 |
23,822 |
10.3% |
50.98 |
|
France |
169,053 |
23,694 |
14.0% |
35.37 |
|
United Kingdom |
162,350 |
21,745 |
13.4% |
32.70 |
|
Belgium |
47,334 |
7,331 |
15.5% |
64.18 |
|
Germany |
159,912 |
6,314 |
3.9% |
7.61 |
|
Iran |
92,584 |
5,877 |
6.3% |
7.18 |
|
Brazil |
73,235 |
5,083 |
6.9% |
2.43 |
|
China |
83,940 |
4,637 |
5.5% |
0.33 |
|
Netherlands |
38,612 |
4,582 |
11.9% |
26.59 |
|
Turkey |
114,653 |
2,992 |
2.6% |
3.63 |
|
Canada |
51,150 |
2,983 |
5.8% |
8.05 |
|
Sweden |
19,621 |
2,355 |
12.0% |
23.13 |
|
Switzerland |
29,264 |
1,699 |
5.8% |
19.95 |
|
Mexico |
16,752 |
1,569 |
9.4% |
1.24 |
|
Ireland |
19,877 |
1,159 |
5.8% |
23.88 |
|
India |
31,324 |
1,008 |
3.2% |
0.07 |
|
Portugal |
24,322 |
948 |
3.9% |
9.22 |
|
Ecuador |
24,258 |
871 |
3.6% |
5.10 |
|
Russia |
93,558 |
867 |
0.9% |
0.60 |
|
Peru |
31,190 |
854 |
2.7% |
2.67 |
|
Indonesia |
9,511 |
773 |
8.1% |
0.29 |
|
Romania |
11,616 |
663 |
5.7% |
3.40 |
|
Poland |
12,218 |
596 |
4.9% |
1.57 |
|
Austria |
15,357 |
569 |
3.7% |
6.43 |
|
Philippines |
7,958 |
530 |
6.7% |
0.50 |
|
Algeria |
3,649 |
437 |
12.0% |
1.03 |
|
Denmark |
9,049 |
434 |
4.8% |
7.49 |
|
Japan |
13,736 |
394 |
2.9% |
0.31 |
|
Egypt |
5,042 |
359 |
7.1% |
0.36 |
|
Pakistan |
14,612 |
312 |
2.1% |
0.15 |
|
Hungary |
2,649 |
291 |
11.0% |
2.98 |
|
Dominican Republic |
6,416 |
286 |
4.5% |
2.69 |
|
Colombia |
5,949 |
269 |
4.5% |
0.54 |
|
Korea, South |
10,761 |
246 |
2.3% |
0.48 |
|
Ukraine |
9,410 |
239 |
2.5% |
0.54 |
|
Czechia |
7,504 |
227 |
3.0% |
2.14 |
|
Israel |
15,728 |
210 |
1.3% |
2.36 |
|
Chile |
14,365 |
207 |
1.4% |
1.11 |
|
Argentina |
4,127 |
207 |
5.0% |
0.47 |
|
Norway |
7,660 |
206 |
2.7% |
3.88 |
|
Finland |
4,740 |
199 |
4.2% |
3.61 |
|
Panama |
6,021 |
167 |
2.8% |
4.00 |
|
Morocco |
4,252 |
165 |
3.9% |
0.46 |
|
Bangladesh |
6,462 |
155 |
2.4% |
0.10 |
|
Saudi Arabia |
20,077 |
152 |
0.8% |
0.45 |
|
Greece |
2,566 |
138 |
5.4% |
1.29 |
|
Serbia |
6,630 |
125 |
1.9% |
1.79 |
|
Moldova |
3,638 |
103 |
2.8% |
2.90 |
|
Malaysia |
5,851 |
100 |
1.7% |
0.32 |
|
South Africa |
4,996 |
93 |
1.9% |
0.16 |
|
Iraq |
1,928 |
90 |
4.7% |
0.23 |
|
United Arab Emirates |
11,380 |
89 |
0.8% |
0.92 |
|
Luxembourg |
3,741 |
89 |
2.4% |
14.64 |
|
Australia |
6,744 |
89 |
1.3% |
0.36 |
|
Slovenia |
1,408 |
86 |
6.1% |
4.16 |
|
Belarus |
12,208 |
79 |
0.6% |
0.83 |
|
North Macedonia |
1,421 |
71 |
5.0% |
3.41 |
|
Honduras |
702 |
64 |
9.1% |
0.67 |
|
Bosnia and Herzegovina |
1,585 |
63 |
4.0% |
1.90 |
|
Croatia |
2,047 |
63 |
3.1% |
1.54 |
|
Afghanistan |
1,828 |
58 |
3.2% |
0.16 |
|
Cuba |
1,437 |
58 |
4.0% |
0.51 |
|
Cameroon |
1,705 |
58 |
3.4% |
0.23 |
|
Bulgaria |
1,399 |
58 |
4.1% |
0.83 |
|
Thailand |
2,938 |
54 |
1.8% |
0.08 |
|
Bolivia |
1,014 |
53 |
5.2% |
0.47 |
|
Estonia |
1,660 |
50 |
3.0% |
3.79 |
|
Lithuania |
1,344 |
44 |
3.3% |
1.58 |
|
Nigeria |
1,532 |
44 |
2.9% |
0.02 |
|
Burkina Faso |
638 |
42 |
6.6% |
0.21 |
|
Andorra |
743 |
41 |
5.5% |
53.24 |
|
San Marino |
553 |
41 |
7.4% |
121.36 |
|
Tunisia |
975 |
40 |
4.1% |
0.35 |
|
Niger |
709 |
31 |
4.4% |
0.14 |
|
Armenia |
1,867 |
30 |
1.6% |
1.02 |
|
Congo (Kinshasa) |
471 |
30 |
6.4% |
0.04 |
|
Albania |
750 |
30 |
4.0% |
1.05 |
|
Somalia |
528 |
28 |
5.3% |
0.19 |
|
Sudan |
318 |
25 |
7.9% |
0.06 |
|
Kazakhstan |
3,027 |
25 |
0.8% |
0.14 |
|
Mali |
424 |
24 |
5.7% |
0.13 |
|
Lebanon |
717 |
24 |
3.3% |
0.35 |
|
Kuwait |
3,440 |
23 |
0.7% |
0.56 |
|
Azerbaijan |
1,717 |
22 |
1.3% |
0.22 |
|
Slovakia |
1,384 |
20 |
1.4% |
0.37 |
|
New Zealand |
1,474 |
19 |
1.3% |
0.39 |
|
Ghana |
1,671 |
16 |
1.0% |
0.05 |
|
Liberia |
141 |
16 |
11.3% |
0.33 |
|
Cyprus |
837 |
15 |
1.8% |
1.26 |
|
Uruguay |
625 |
15 |
2.4% |
0.43 |
|
Guatemala |
530 |
15 |
2.8% |
0.09 |
|
Kenya |
374 |
14 |
3.7% |
0.03 |
|
Singapore |
14,951 |
14 |
0.1% |
0.25 |
|
Cote d'Ivoire |
1,183 |
14 |
1.2% |
0.06 |
|
Latvia |
836 |
13 |
1.6% |
0.67 |
|
Diamond Princess |
712 |
13 |
1.8% |
nan |
|
Kosovo |
510 |
12 |
2.4% |
0.65 |
|
Bahamas |
80 |
11 |
13.8% |
nan |
|
Iceland |
1,795 |
10 |
0.6% |
2.83 |
|
Oman |
2,131 |
10 |
0.5% |
0.21 |
|
Mauritius |
334 |
10 |
3.0% |
0.79 |
|
Tanzania |
299 |
10 |
3.3% |
0.02 |
|
Qatar |
11,921 |
10 |
0.1% |
0.36 |
|
Venezuela |
329 |
10 |
3.0% |
0.03 |
|
Paraguay |
239 |
9 |
3.8% |
0.13 |
|
Senegal |
823 |
9 |
1.1% |
0.06 |
|
Bahrain |
2,811 |
8 |
0.3% |
0.51 |
|
El Salvador |
345 |
8 |
2.3% |
0.12 |
|
Uzbekistan |
1,939 |
8 |
0.4% |
0.02 |
|
Trinidad and Tobago |
116 |
8 |
6.9% |
0.58 |
|
Congo (Brazzaville) |
207 |
8 |
3.9% |
0.15 |
|
Guyana |
74 |
8 |
10.8% |
1.03 |
|
Jordan |
449 |
8 |
1.8% |
0.08 |
|
Kyrgyzstan |
708 |
8 |
1.1% |
0.13 |
|
Guinea |
1,240 |
7 |
0.6% |
0.06 |
|
Sri Lanka |
619 |
7 |
1.1% |
0.03 |
|
Montenegro |
321 |
7 |
2.2% |
1.12 |
|
Jamaica |
364 |
7 |
1.9% |
0.24 |
|
Taiwan* |
429 |
6 |
1.4% |
0.03 |
|
Costa Rica |
705 |
6 |
0.9% |
0.12 |
|
Togo |
99 |
6 |
6.1% |
0.08 |
|
Georgia |
511 |
6 |
1.2% |
0.16 |
|
Haiti |
76 |
6 |
7.9% |
0.05 |
|
Barbados |
80 |
6 |
7.5% |
2.09 |
|
Burma |
150 |
5 |
3.3% |
nan |
|
Zimbabwe |
32 |
4 |
12.5% |
0.03 |
|
Malta |
458 |
4 |
0.9% |
0.83 |
|
Monaco |
95 |
4 |
4.2% |
10.34 |
|
Sierra Leone |
104 |
4 |
3.8% |
0.05 |
|
Malawi |
36 |
3 |
8.3% |
0.02 |
|
Antigua and Barbuda |
24 |
3 |
12.5% |
3.12 |
|
Gabon |
238 |
3 |
1.3% |
0.14 |
|
Nicaragua |
13 |
3 |
23.1% |
0.05 |
|
Ethiopia |
126 |
3 |
2.4% |
0.00 |
|
Zambia |
95 |
3 |
3.2% |
0.02 |
|
Syria |
43 |
3 |
7.0% |
nan |
Table 2. Deaths involving coronavirus disease 2019 (COVID-19), pneumonia, and influenza reported to NCHS by age group, United States. Week ending 2/1/2020 to 4/25/2020.*Data as of April 29, 2020 [improved formatting added] |
||||||
|
Age group |
COVID-19 Deaths (U07.1)1 |
Deaths from All Causes |
Pneumonia
Deaths |
Deaths
with Pneumonia and COVID-19 |
Influenza
Deaths |
Population4 |
|---|---|---|---|---|---|---|
|
All ages |
33,513 |
706,401 |
61,898 |
14,910 |
5,792 |
327,167,434 |
|
Under 1 year |
4 |
3,662 |
34 |
1 |
11 |
3,848,208 |
|
1–4 years |
2 |
704 |
33 |
2 |
30 |
15,962,067 |
|
5–14 years |
3 |
1,057 |
37 |
0 |
40 |
41,075,169 |
|
15–24 years |
37 |
6,251 |
130 |
15 |
41 |
42,970,800 |
|
25–34 years |
253 |
13,296 |
438 |
106 |
130 |
45,697,774 |
|
35–44 years |
627 |
19,177 |
991 |
249 |
205 |
41,277,888 |
|
45–54 years |
1,721 |
37,124 |
2,556 |
710 |
508 |
41,631,699 |
|
55–64 years |
4,199 |
89,413 |
7,497 |
1,844 |
1,068 |
42,272,636 |
|
65–74 years |
7,220 |
139,006 |
12,862 |
3,177 |
1,264 |
30,492,316 |
|
75–84 years |
9,142 |
174,636 |
17,096 |
4,178 |
1,291 |
15,394,374 |
|
85 years and over |
10,305 |
222,075 |
20,224 |
4,628 |
1,204 |
6,544,503 |
|
NOTE: Number of deaths reported in this table are the total number of deaths received and coded as of the date of analysis and do not represent all deaths that occurred in that period. *Data during this period are incomplete because of the lag in time between when the death occurred and when the death certificate is completed, submitted to NCHS and processed for reporting purposes. This delay can range from 1 week to 8 weeks or more, depending on the jurisdiction, age, and cause of death. 1Deaths with confirmed or presumed COVID-19, coded to ICD–10 code U07.1. 2Pneumonia death counts exclude pneumonia deaths involving influenza. 3Influenza death counts include deaths with pneumonia or COVID-19 also listed as a cause of death. 4Population is based on 2018 postcensal estimates from the U.S. Census Bureau (9) |
||||||
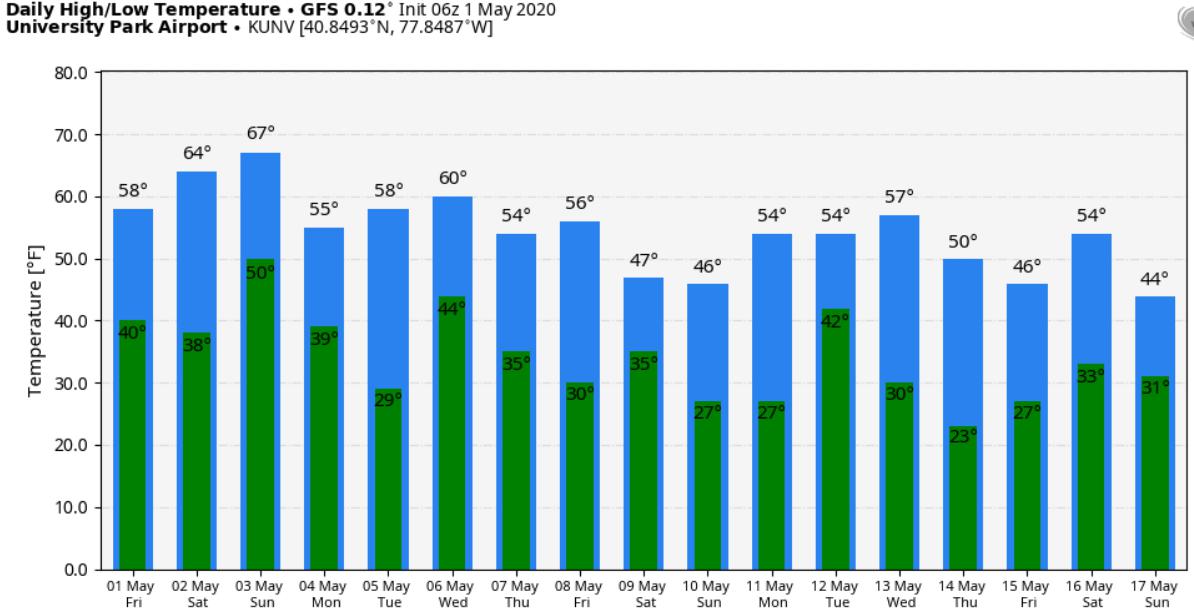
Central Pa current and future...Joe Bastardi
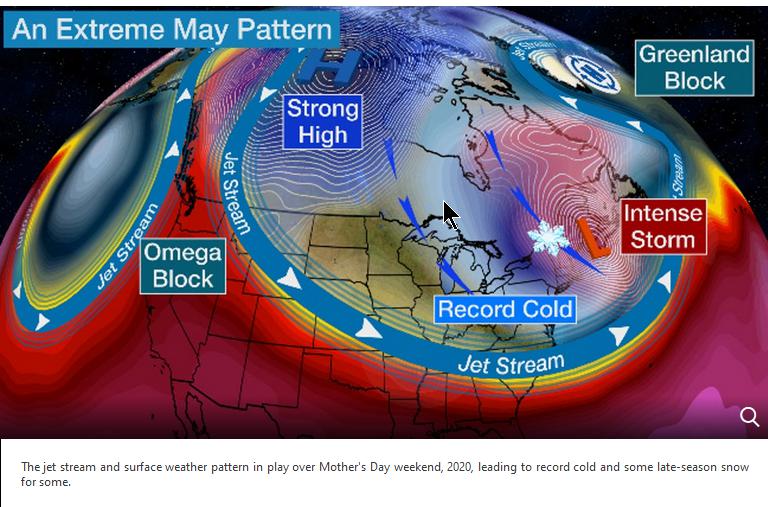
A chilly weather pattern for May set more cold temperature records in parts of the East into midweek.
Numerous record lows were already set Mother's Day weekend, and an area of low pressure wrung out strange May snow in the interior Northeast.
The record-breaking cold weather was from a southward plunge of the jet stream in place to the east of the Rockies. That allowed a pipeline of cold air to dive southward from Canada into parts of the central and eastern United States.
All-time May record lows were set Saturday morning, May 9, in Binghamton, New York (24 degrees); Fort Wayne, Indiana (23 degrees); Indianapolis (27 degrees); New York's LaGuardia Airport (36 degrees) and Jackson, Kentucky (30 degrees). State College, Pennsylvania (27 degrees), New York's JFK Airport (34 degrees) and London, Kentucky (28 degrees), tied their all-time May records Saturday morning.
According to the National Weather Service, prior to Saturday, the latest spring date Fort Wayne, Indiana, plunged to 23 degrees was April 20, 1897, and 1904, almost three weeks earlier in the spring.
Nashville, Tennessee, also plunged to its coldest low so late in spring Saturday morning, beating its previous record-latest 35-degree low by three days.
Washington's Reagan National Airport (37 degrees) dipped to its coldest May low since 1966. Peoria, Illinois, had its latest spring freeze since 1971.
Van Wert, Ohio, plunged to 18 degrees Saturday morning, the first time it had dropped into the teens in May in 127 years of records.
Wind chills were as cold as the teens, even upper single digits, in parts of the East Saturday morning.
Boston's temperature only rose to 44 degrees Saturday afternoon, setting a new record-cold high temperature for May 9.
New daily record lows for May 10 were set Sunday morning in Trenton, New Jersey (31 degrees); Richmond, Virginia (32 degrees); Shreveport, Louisiana (47 degrees); and Wilmington, North Carolina (41 degrees). Boston and Providence, Rhode Island, both tied their daily record lows of 34 degrees Sunday morning.
New daily record lows for May 11 were set Monday morning in Bismarck, North Dakota (24 degrees – tie), International Falls, Minnesota (21 degrees), and Columbia, Missouri (36 degrees).
Daily record lows were tied or broken on Tuesday morning, May 12, in International Falls, Minnesota (18 degrees), Rochester, New York (30 degrees, tied), Columbus, Ohio (32 degrees), Dayton, Ohio (32 degrees), Wilmington, North Carolina (45 degrees, tied).
On May 12, both Cape Girardeau, Missouri (54 degrees), and Paducah, Kentucky (56 degrees), both had their coldest day so late in the season since 1981.
On May 13, Rochester, New York, had its coldest May morning in 41 years.
Snow Notables
Pittsburgh reported a trace of snow both on May 8 and May 9, the first consecutive May days of snow there in 97 years.Detroit topped them, recording at least a trace of snow five straight days, a record such streak for May in the Motor City. The previous streak set 80 years ago was only three straight days.
And, as noted by National Weather Service-Charleston, West Virginia, meteorologist Nick Webb, Snowshoe, West Virginia, set its record 24-hour May snowfall in 45 years of records. Elkins, West Virginia, also set a new 24-hour May snow record, picking up 1.5 inches of snow on May 8.This forecast prompted the National Weather Service office in Caribou, Maine, to issue its first May winter storm warning in at least 15 years.
Rare May lake-effect snowbands and snow squalls spread across the Great Lakes and interior Northeast on Saturday. Overpasses were snow-covered in parts of western Pennsylvania, according to live cams. Graupel mixed in across parts of the Interstate 95 corridor.
Parts of upstate New York, Vermont, New Hampshire and Maine picked up 3 to 6 inches of snow, with up to 14 inches in eastern Maine.
One location near the Vermont-New York border northeast of Albany at an elevation of 1,300 feet reported 1 foot of new snow Saturday morning.
Light snow accumulations were reported in parts of western and central Massachusetts and the Litchfield Hills of northern Connecticut. https://weather.com/forecast/regional/news/2020-05-07-mothers-day-weekend-record-cold-snow-bombogenesis-extreme-pattern